

Investing in the stock market can be exciting, but it is important to research a company before buying its stock. Buying a stock without research is like buying a car without checking the engine first. Smart investors always analyze a company’s financial information before making a decision. In this tutorial, I will show how beginners can analyze a stock using Yahoo Finance in four simple steps.
Step 1: Search the Company
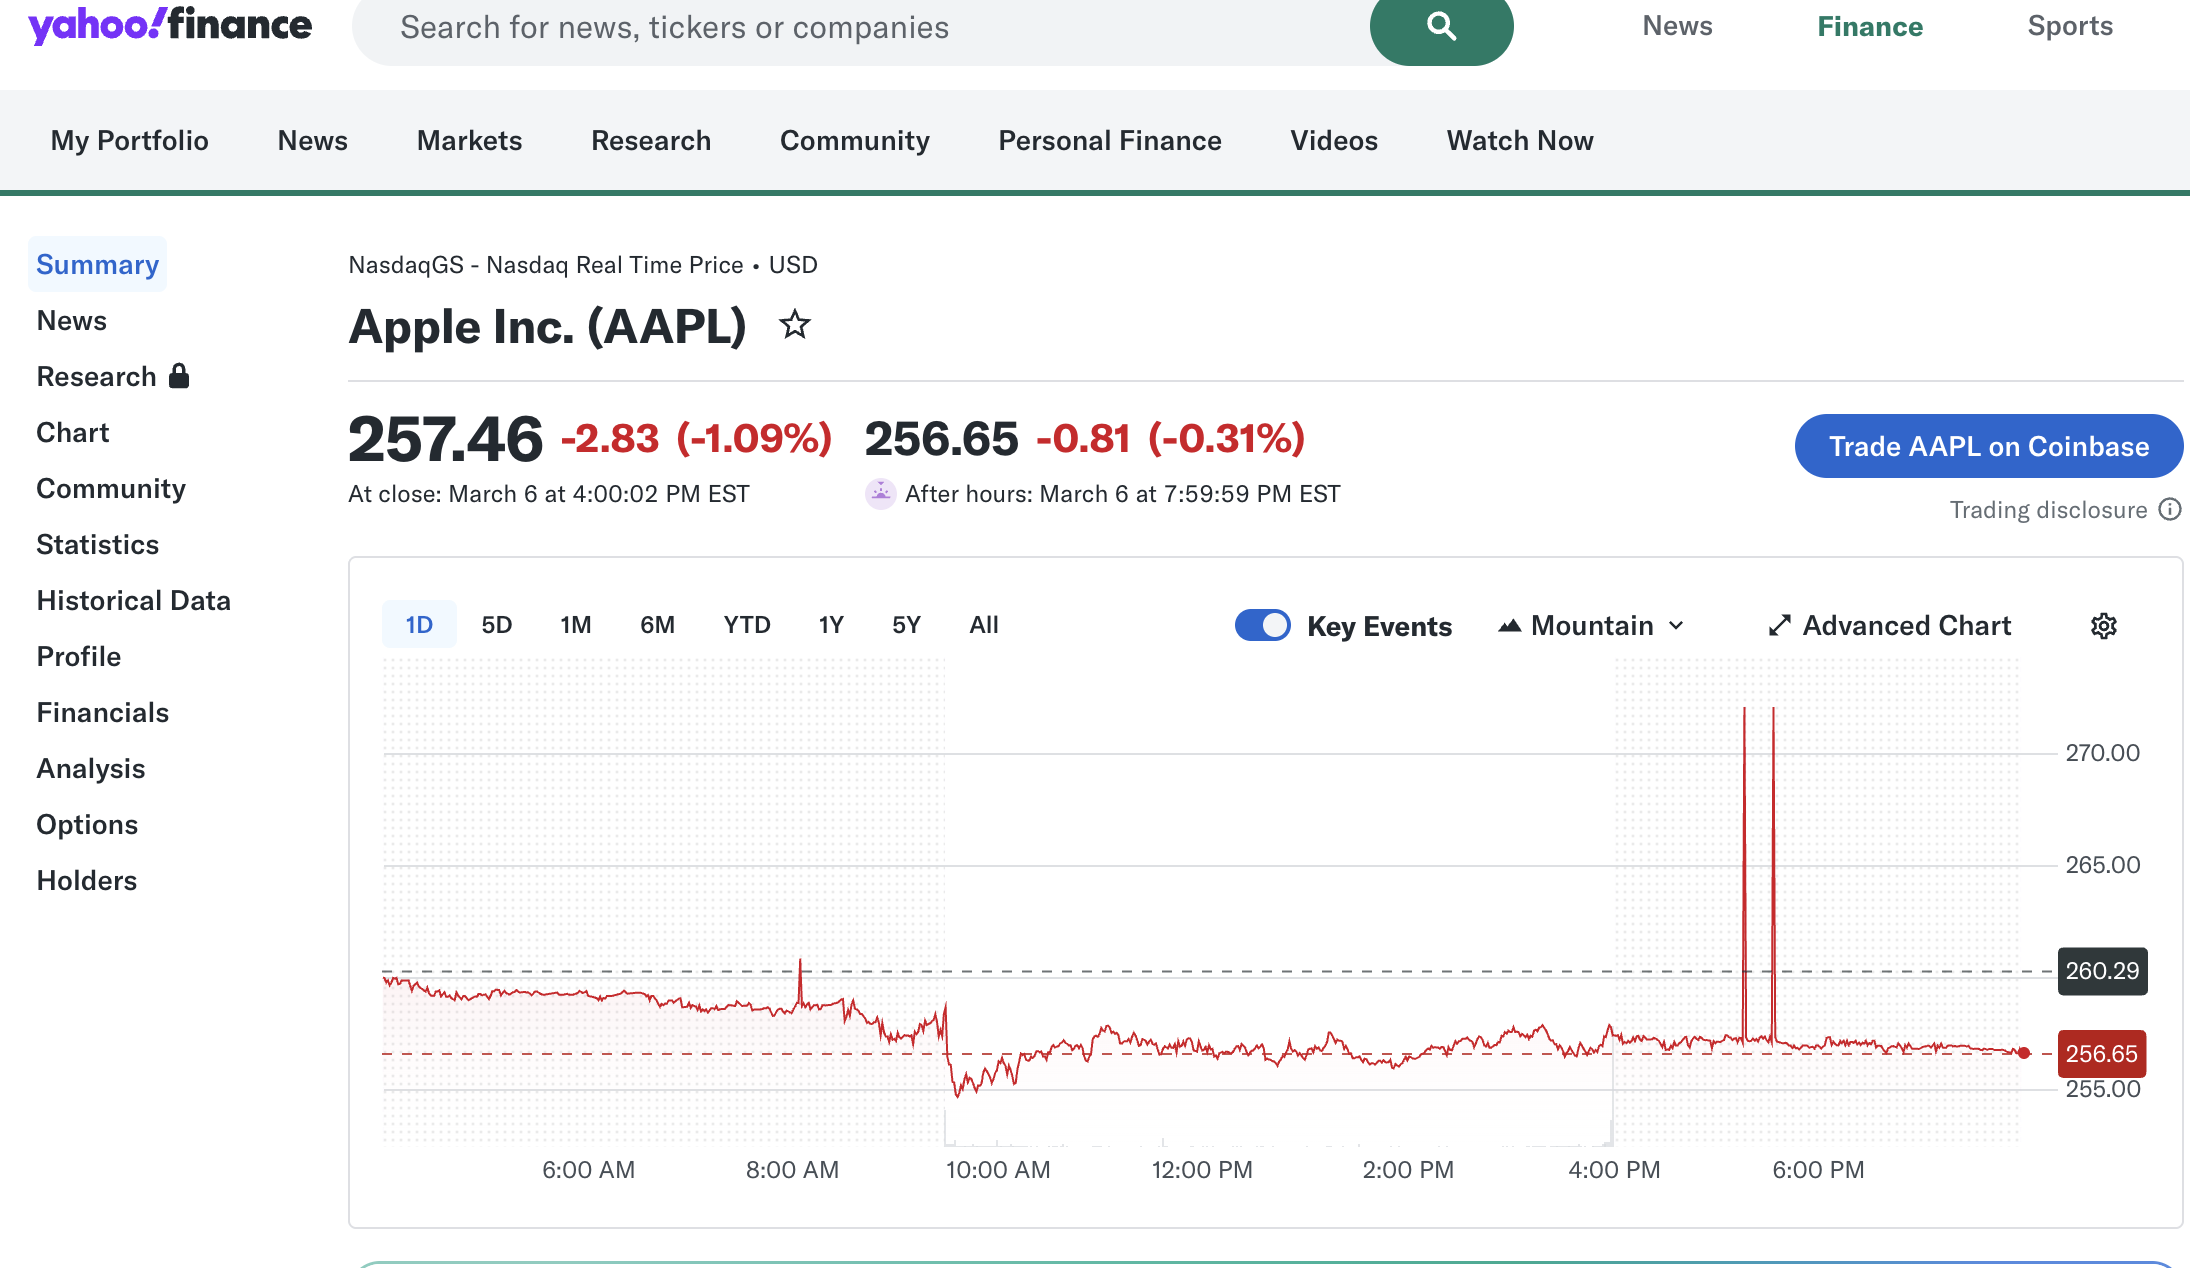
The first step is to search for the company you want to analyze. Go to the Yahoo Finance website and type the company’s ticker symbol into the search bar. A ticker symbol is a short abbreviation used to identify a publicly traded company.
For example, Apple’s ticker symbol is AAPL. After searching the ticker, you will be taken to the company’s stock page. This page shows the current stock price, market information, charts, and financial data.
Step 2: Check Key Statistics
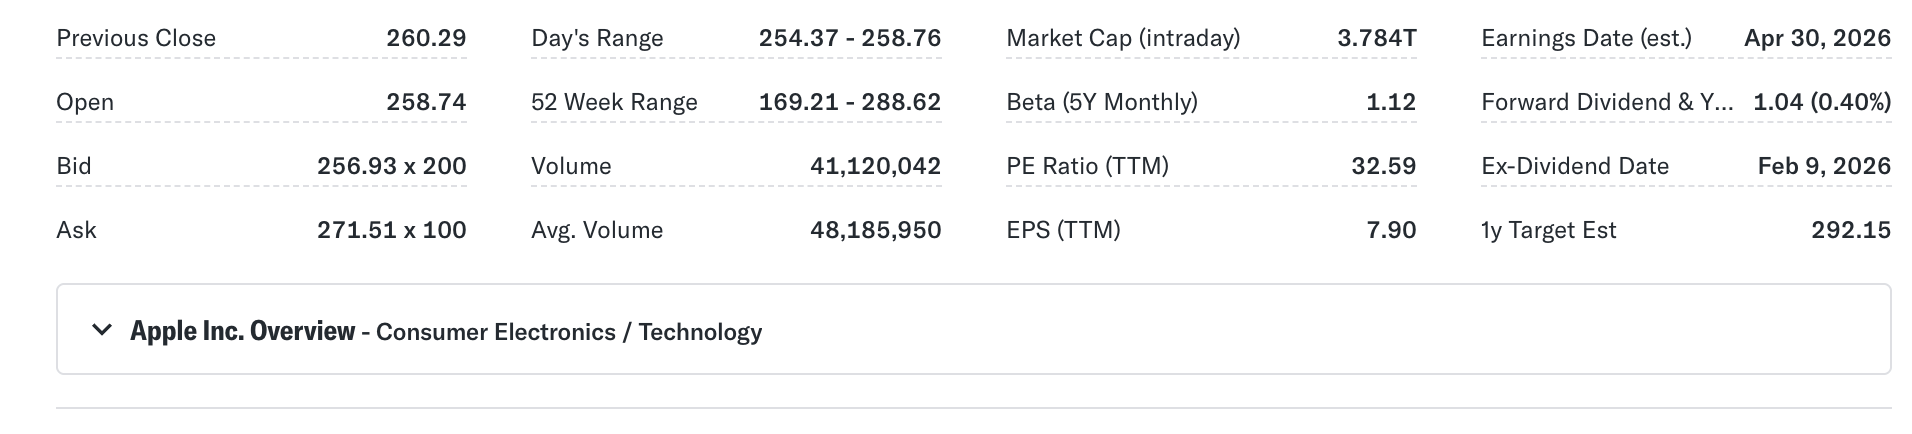
The next step is reviewing some important statistics about the company. These numbers help investors understand the size, value, and profitability of a business.
Some important metrics include:
- Market Cap – the total value of the company
- P/E Ratio – shows how expensive a stock is compared to its earnings
- EPS (Earnings Per Share) – shows how much profit the company makes for each share
Looking at these numbers helps investors quickly evaluate whether a company may be a good investment.
Step 3: Review Financial Statements
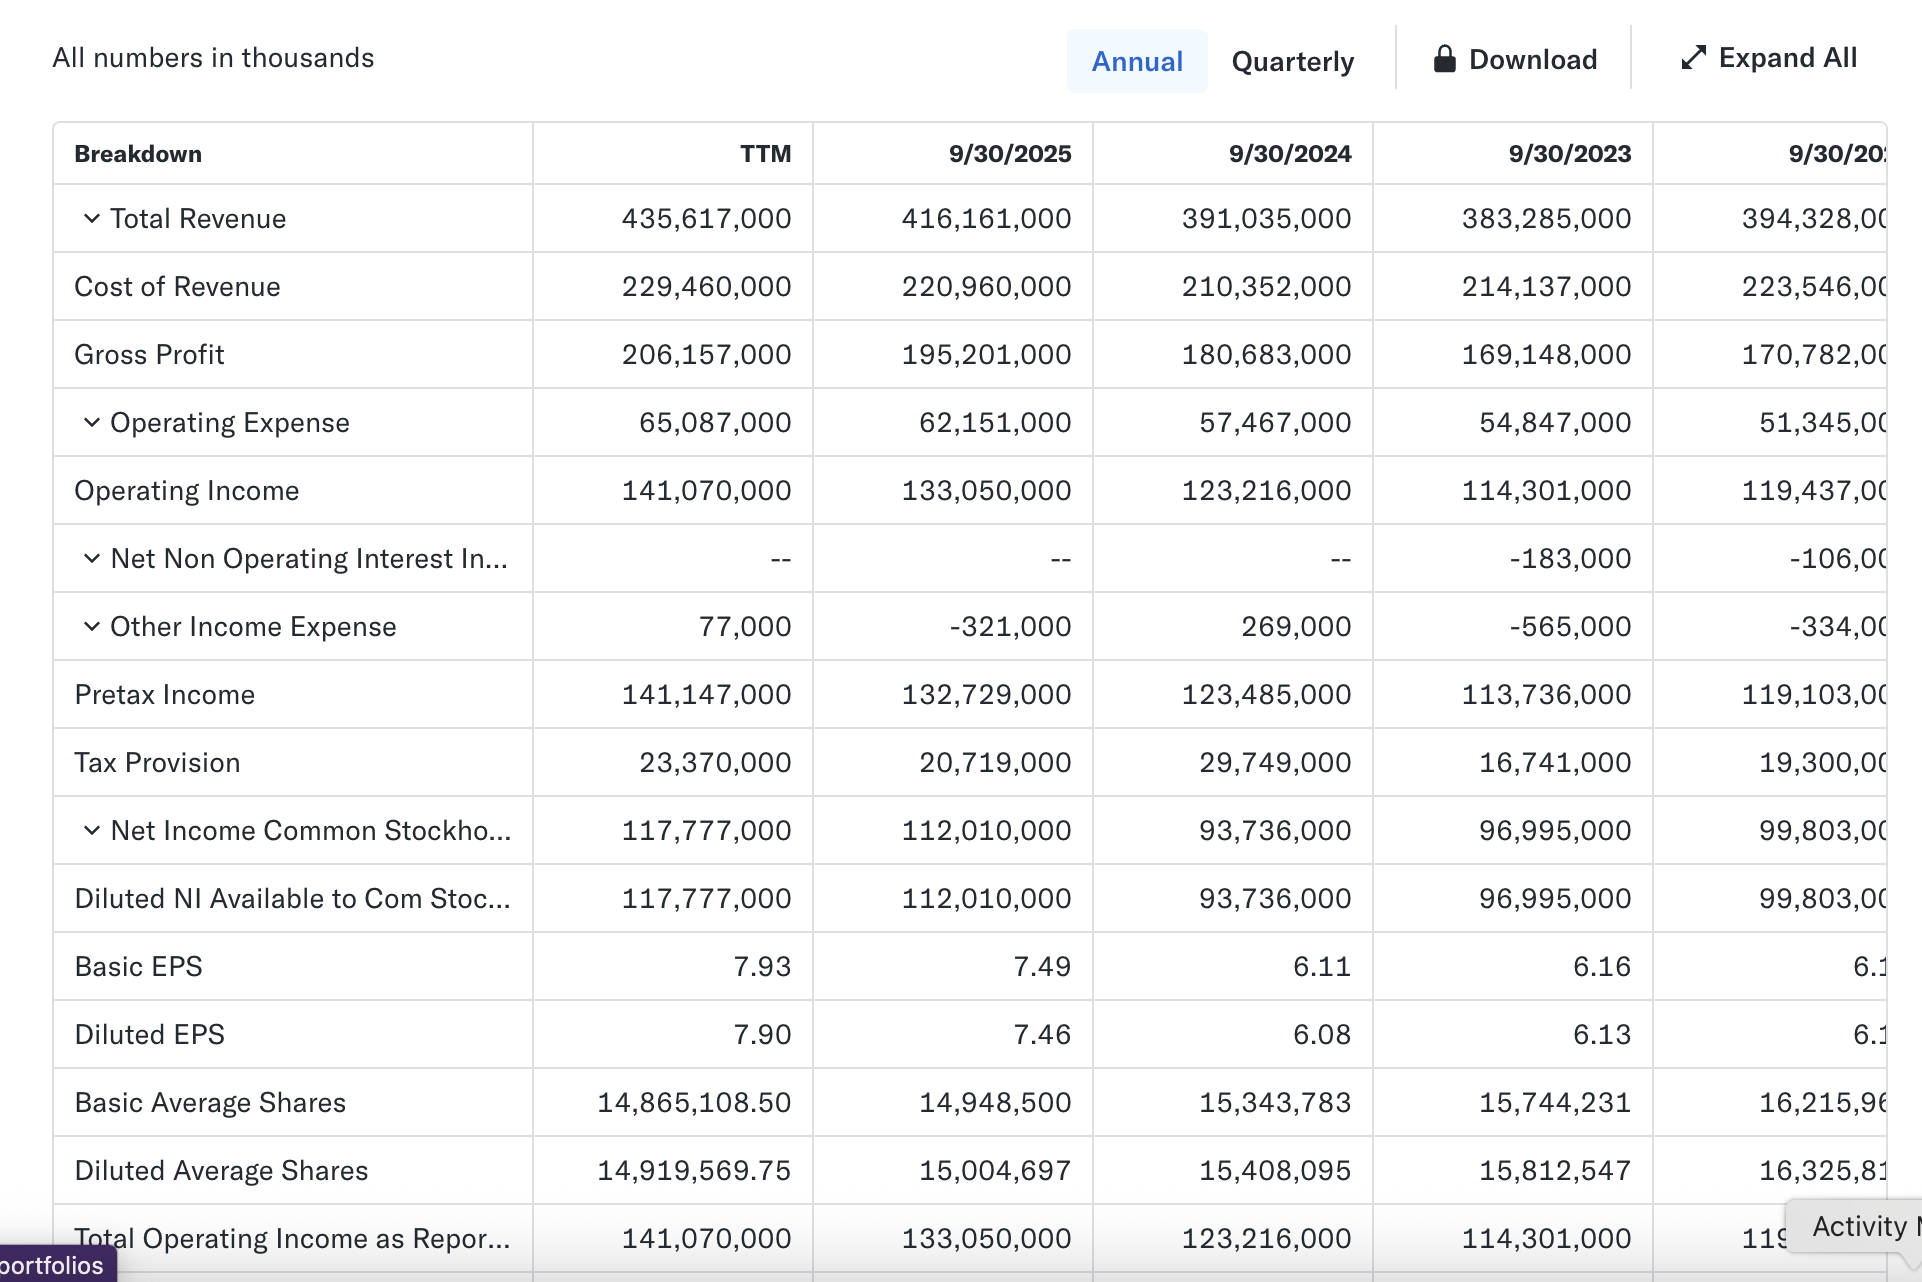
The third step is reviewing the company’s financial statements. On Yahoo Finance, click on the Financials tab to see the company’s income statement.
Two important numbers to focus on are:
- Revenue – the total money the company earns from sales
- Net Income – the company’s profit after expenses
If revenue and profits are growing over time, it usually means the company is performing well.
Step 4: Analyze the Stock Chart
The final step is analyzing the stock chart. Yahoo Finance allows you to view the stock price over different time periods.
For example:
- 1-Year Chart shows short-term price trends
- 5-Year Chart shows long-term growth patterns
Looking at charts helps investors understand how the stock has performed over time and identify trends in the market.
Conclusion
Yahoo Finance is a powerful and free tool that helps investors research companies before investing. By searching the ticker symbol, reviewing key statistics, analyzing financial statements, and studying the stock chart, investors can better understand a company’s performance.
Doing proper research before investing can help reduce risk and lead to better financial decisions. For beginners who want to start learning about stocks, Yahoo Finance is a great place to begin.
Watch My Tutorial Video
Citation
Yahoo Finance – https://finance.yahoo.com
